
Pr Jean Dausset, Prix Nobel de Médecine, 1980


| Introduction | Database | Genotype submission | Sequence submission | Access policy | Publications |
HGDP-CEPH Allelic Frenquency Database Help Page
Searching the Database
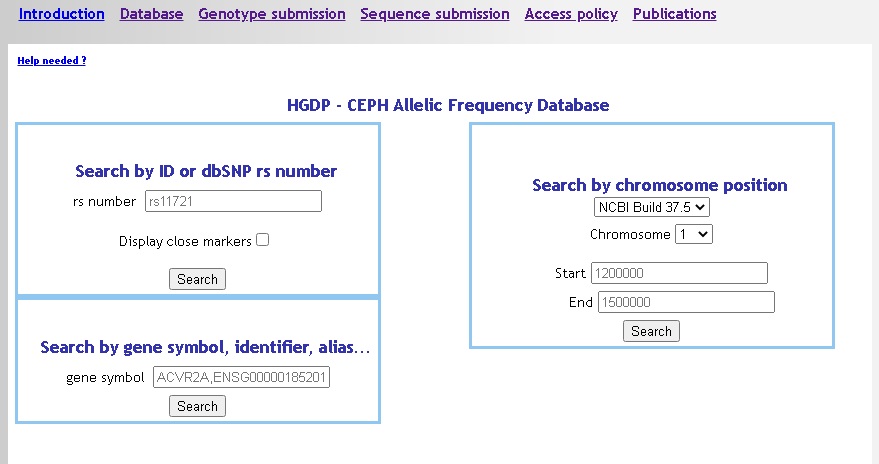
We provide three different search options, all three search for exact matches (no wildcard, no partial match) :
- by marker identifier: dbSNP ID or submitter ID (optionnaly retrieving markers in the +/- 10Kb range).
- by gene symbol: Gene name or alias, EnsEMBL Gene identifier (ENSG), HUGO identifier.
- by genomic position: select the reference (HG18 or HG19), then the chromosome and the interval of interest. Positions support short form in kilobases (K) and megabases (M), e-g: 120K = 120.000 bases, 14M = 14.000.000 bases.
Single result display
If your query retrieves only one marker, the detailed information is directly on display:
- submitter ID
- dbSNP ID if available (link to dbSNP)
- Alleles
- Genomic position (HG18 and HG19)
- Gene locus if available
- Submitters frequencies as tabs, the current submitter on display is highlighted in grey, click on another submitter id on the 'display submission' line to change the map/table values accordingly.
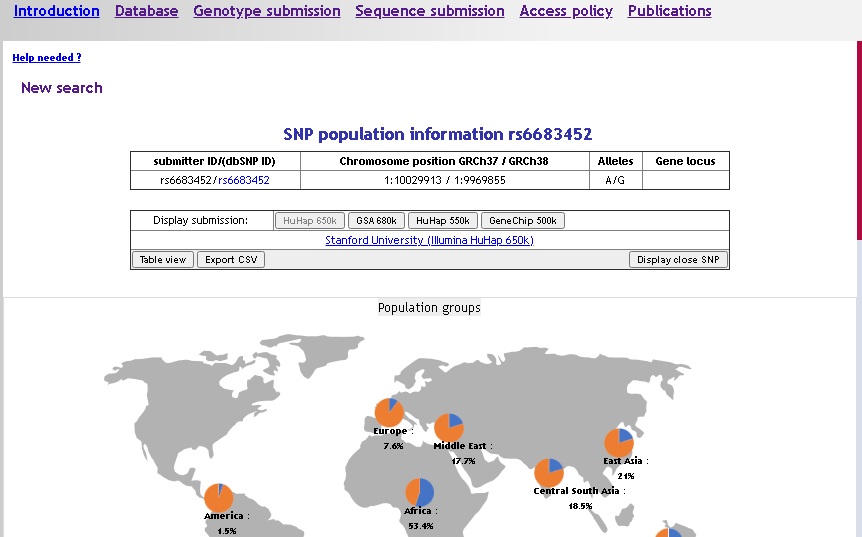
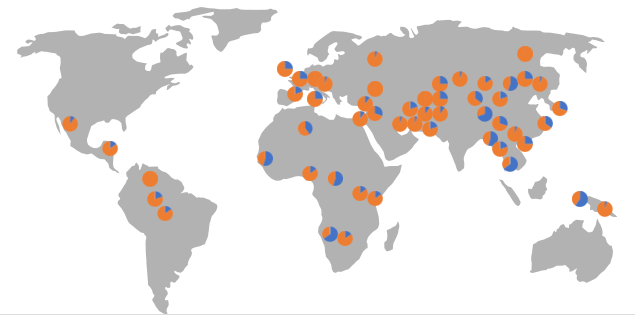
The default view is the map mode, showing frequencies as piecharts: one map for population groups, and one map for populations (scroll down if not visible on the results page). To display a population name and the corresponding frequency on the population map, place the mouse over a piechart (don't click !) and the information will pop up after a very short time.
To display the frequency information as a table, click the 'Table view' button (click again to switch between map and table):
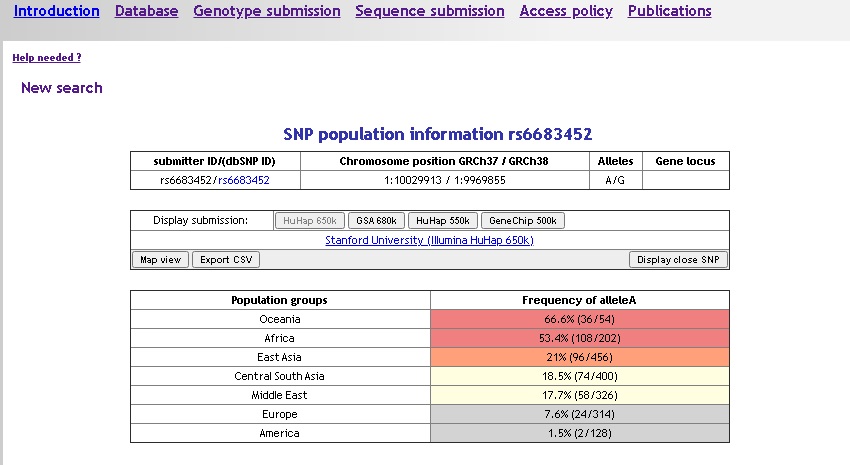
Use the 'Export csv' button to create a text file containing the marker information, frequencies by population and population group.
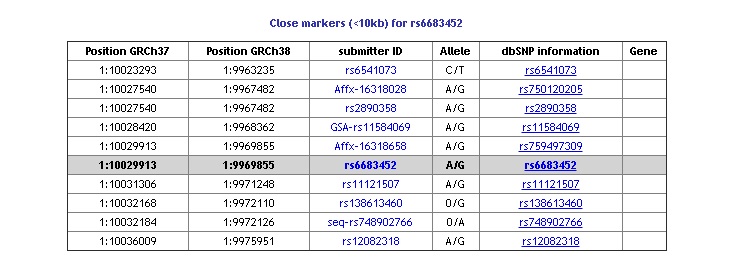
Close markers information
If you select to display close markers in your query, at the bottom of the single result page is a table with information about markers within a +/-10Kb range. This information is be available in the export file.
Multiple results
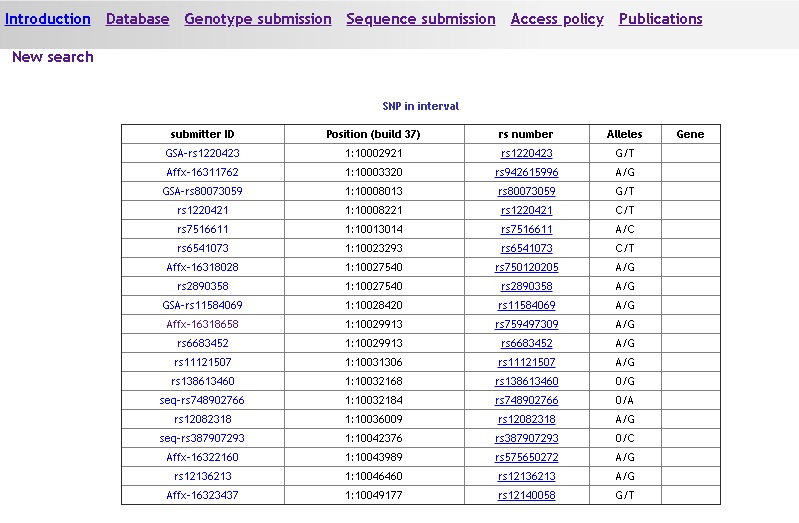
If your query returns more than one marker -typically when searching by position or by gene- the result is a list of markers with basic information:
- Submitter identifier
- Genomic position
- rs number if available (link to dbSNP)
- Alleles
- Gene locus if applicable
Click on the marker submitter identifier in the leftmost column to display the frequency detail page.
List display also occurs when searching by rs number (dbSNP), when several collaborators give different identifiers for the same rs number, the results are not fully merged, in order to keep each submitter identifier available.